 |
Figure1: Treisman's 'Spotlight' model of visual attention (1986), adapted from Kolb & Wishaw (1996) by author
|
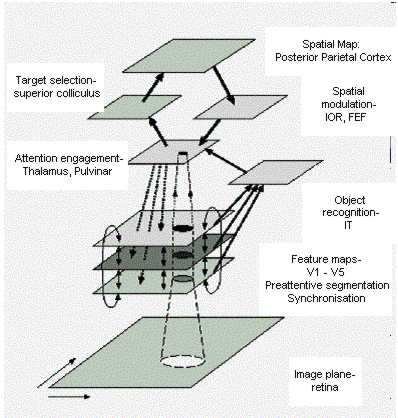 |
Figure 2: speculative mapping of neural pathways possibly corresponding to Treisman's model (based on Theeuwes, 1993 and Milner & Goodale, 1995)
|
 |
Figure 3: Bottom-up processing (author)
|
 |
Key:
V1 - Visual area 1
V2 - Visual area 2
V4 - Visual area 4
AIT - Anterior inferotemporal area
CIT - Central inferotemporal area
PIT -Posterior inferotemporal area
VIP - Ventral intraparietal area
LIP - Lateral intraparietal area
MT - middle temporal area
MST - medial superior temporal area
7a - Brodmann's area 7a |
Figure 4: visual areas indicated for the macaque monkey. Redrawn from Maunsell & Ferrera (1995)
|