 |
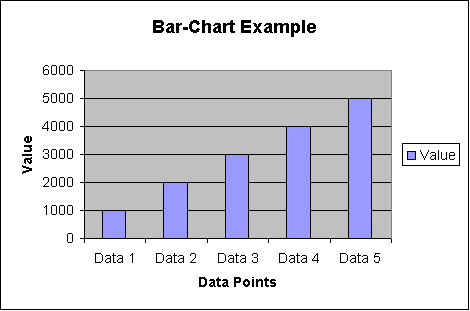
Figure 1: a commercial "graph" - actually a bar-chart. Useful, but you can't say anything about values between the plotted points
|
 |
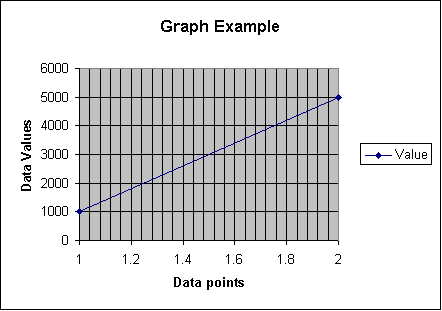
Figure 2: a true graph. There's only two points plotted, one at each end, but any in-between point can be estimated
|
 |
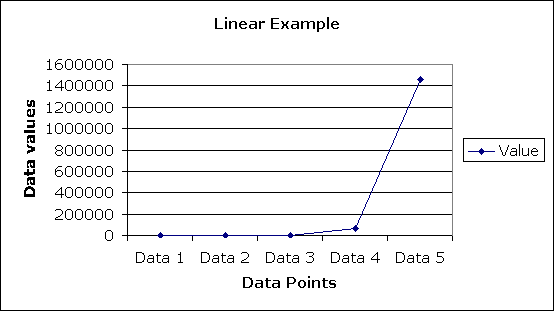
Figure 3: here we see what happens if we try to plot wildly different values on a linear graph: 2, 12, 31, 69 000, 1 457 000
|
 |
Figure 4: and here we see that with a logarithmic graph, there's no real problem: again, 2, 12, 31, 69 000, 1 457 000. Most human senses - hearing, sight - touch and taste as well, in all probability - work this way, logarithmically.
|


